- Joplin tornado formed from unique merger of two strong storms
- Data visualization lets researchers observe atmospheric behaviors in action
- Results from visualizations lead to improved forecasts
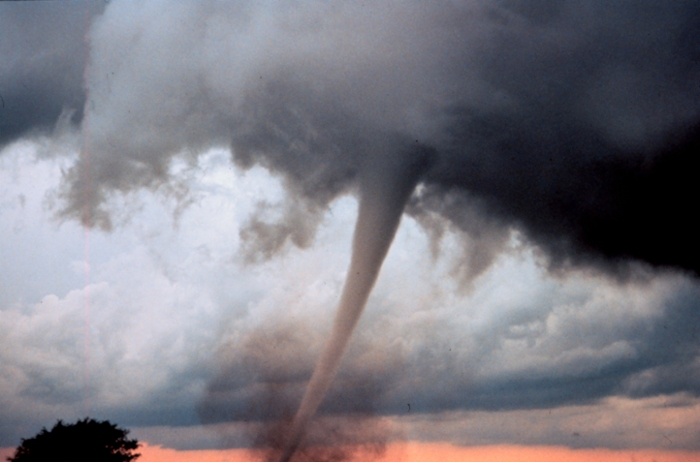
A 2011 tornado in Joplin, Missouri lasted for 38 minutes, claimed 158 lives, and resulted in over 16,000 insurance claims totaling in excess of $2 billion dollars—more than any other single event in the history of the state.
It’s not an event anyone in Missouri would like to repeat. Which is why David Bock of the National Center for Supercomputing Applications' (NCSA) and Brian Jewett of the have meticulously crafted a visualization of the 2011 storm.
You might wonder how it’s possible to gain present-day insights from a tornado that happened over seven years ago. But by creating this visualization, researchers have been able to gather vital information about storm behavior.
 With the power of data visualization, data becomes explicitly visible, giving us tangible insight into understanding atmospheric behaviors. So long as relevant data exists (radar imagery, temperature and humidity data, etc.), it can be molded into something visible.
Thanks to an allocation from the (XSEDE), which connects researchers with relevant resources and expertise, enabling accelerated discovery from scientific experts, , a professor of Atmospheric Science at the University of Illinois, has been able to collaborate with NCSA visualization expert David Bock to help to reveal some of these storm behaviors.
"There are still questions about how a tornado starts, and numerical simulation is critical to addressing a lot of those questions," said Jewett. "Numerical models give you two things. First, they give you an incredibly detailed time and space of what’s going on, so as often as one chooses to save the data, you can establish continuity, a vital aspect of a weather simulation."
 These models also give researchers like Jewett an extra tool in analyzing storms—they allow for variables to be changed to observe storms under different conditions.
"One can also go in and tweak things in numerical models," Jewett said. "For example, in the past if you wanted to study a warm case and a cold case, you'd have to dig through weather maps and find cases with identical conditions. With the model, we can control the amount of rain or sunshine or even the time of year, and see how a given storm reacts."
Now that numerical simulations can be run, the help of a visualization expert is needed to transform the data into something visible. That's where NCSA's David Bock comes in. With the help of Jewett, he takes massive amounts of data and turns them into something we can see, and in turn, learn about, even when the concepts are novel.
 "In the Joplin storm, there were actually two storms that were merging. Before this, we had visualized one big storm, but we never had to consider different regions of the same data model," said Bock
"How do you color these distinct storms differently to tell the difference between them? What happens when these storms merge? We're talking about how to do that, and it's fascinating to extend my software to do these new, complex things."
Both on the visualization and modeling ends, however, there is substantial work yet to be done.
"As you saw with the Joplin storm, looking at it from above, it's beautiful," said Bock. "But we don't have enough resolution to see the space where the tornado forms. We need more frames and we need more data, but to me, that's the exciting part. We figure out what combination of variables we want to look at, and then we can run another simulation to look closer."
While this may not provide us all of the answers, visualizing the previously un-visualized leads to important scientific insights—ones that could help us better predict and prepare for deadly tornadic events like those in Joplin seven years ago.
"Decades ago, scientists at (National Center for Atmospheric Research) developed simulations that showed splitting storms. After their work was released, people starting looking at splitting storms much closer," said Jewett.
"In turn, simulations can inform the community with things to look out for, which has led to strides made in forecasting and warning. It hasn't painted the whole picture, but these sort of simulations can inform the general public's understanding of atmospheric sciences."
Read more:
- Tornadogenesis: probabilities for better predictions
- Photorealistic thunderstorm simulation wins XSEDE15 people's choice award