- Weather and user emotion correlated in new visualization tool.
- NSF-funded supercomputers at University of Nebraska-Lincoln drive analytical tool.
- Predictive power could yield useful results for scientists, citizens, and city planners.
Changes in the climate have our attention today, and many of us share an anxiety about looming negative consequences for our planet. But researchers sponsored by the US may have found an even more personal implication of climate change: It can hurt your feelings.
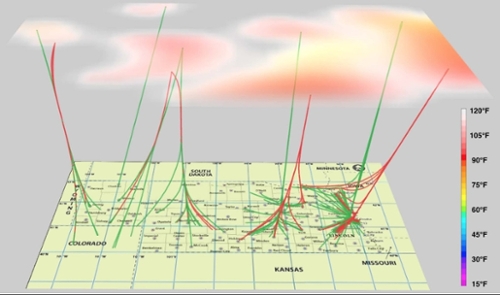
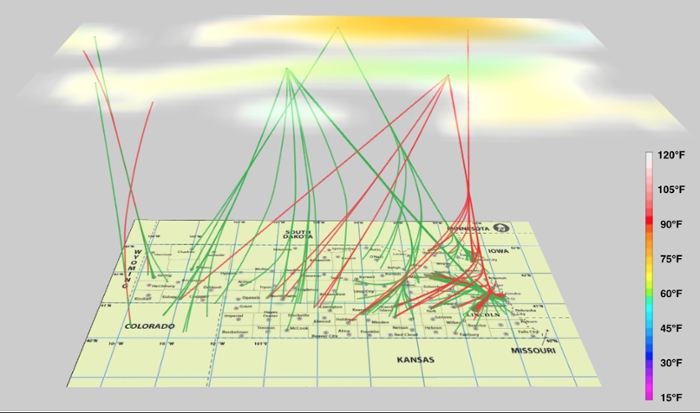
In fact, proper analysis might be able to forecast your feelings days in advance. That’s the potential offered by Tweether, a visualization of real-time Twitter and weather data that shows how the feelings of users can fluctuate with the weather. Tweether visualizes selected clusters of weather on a 3D map, and graphs a correlation with tweeted sentiments.

Forecast of smiles
It’s no surprise that weather and emotions are linked. Weather affects our daily lives, from what we wear, what activities we do, what type of transportation we use, what we eat – and how we feel.
How we feel changes what we buy, where and when we travel, and these decisions affect society collectively. Will there be more cyclists on the road tomorrow? Will the cost of grain go down? Shall I put some coats in the shop display window?
To make smart decisions based on the correlation between weather and human sentiment calls for a way to extract and see the connection. Enter Tweether.
With Tweether, researchers were able to predict user sentiment with close to 90 percent accuracy.
“We thought categorizing similar feelings from a large number of people might reveal some useful patterns to help decision makers or shareholders make more appropriate decisions with respect to weather conditions (e.g., fairs or sporting arrangements),” says Hongfeng Yu, assistant professor of Computer Science and Engineering at the . “And so we became interested in the development of a visualization tool to explore the interplay between weather and our daily lives.”
Mood monitors
Yu and colleagues described their methods in an article recently published in . Based on the clustering of weather data and the sentiments of each tweet, the scientists computed and visualized possible correlations between these two entities.
The team started by using a clustering algorithm to extract different weather patterns from the climate simulation. Yu’s colleague Jun Wang, previously on faculty at UNL, now at the at the ran the simulation using the supercomputing resources at the at UNL.
WRF data provides hourly forecasts for as much as 72 hours in the future, and each file contains temperature, precipitation, and wind speed variables, among others. To test their Tweether platform, Yu’s team paid special attention to surface skin temperature variables.
The Twitter data set they employed used the live data feed from Nebraska Twitter users, focusing on the most populous cities in the state. Starting with a training set of around 10,000 tweets, the scientists used the Naive Bayes classifier algorithm to categorize tweets based on the sentiments expressed. They sorted the tweets from eight basic emotions into a negative or positive category.
“Through Tweether, we could clearly see the major temperature distribution, the sentiment classification of tweets, and their relationships,” notes Yu. “For example, being in the midst of summer, we could see that the overall tweets for the colder weather have a more positive sentiment in comparison to the [current] hotter weather.”
The challenging part was using the 72-hour weather forecast to predict moods of twitter users over the same period. Focusing on July , the researchers were able to predict user sentiment with close to 90 percent accuracy.
“Given the possible uncertainty when determining if a person’s mood is truly affected by weather, in the future we plan to involve other social phenomena or events to obtain more concrete correlation results,” Yu notes. “The study of sentiment classification and the sentiment-weather relationship could be enhanced through collaboration with other domain experts.”
Happy horizon
There is more work to be done, Yu admits, such as perfecting sentiment classification, since irony and sarcasm can skew the results.

“In the future, we would like to extend our tool to some more populous states, such as California and New York. It would be very interesting to apply our visualization to such populated areas or in the states which experience less seasonal changes.”
Domain scientists could use Tweether to measure and predict correlation between weather and other social phenomena or events such as traffic accidents, injuries from natural disasters, or even medical episodes like the flu.
If all goes as planned, soon we’ll be able to confirm if rainy days and Mondays indeed do get us down. But while the platform is being perfected, Yu’s visualization has already drastically reduced visual clutter to offer an interactive 3D highlight of the correlation between human sentiment and different weather conditions.
Shruti Daggumati, Igor Soares, Jieting Wu, David Cao, Hongfeng Yu, and Jun Wang contributed to this research project.